Chart-image analysis
Capture or import a readable chart screenshot to organize the visible setup and the context shown in the image.
AI-assisted chart analysis and learning
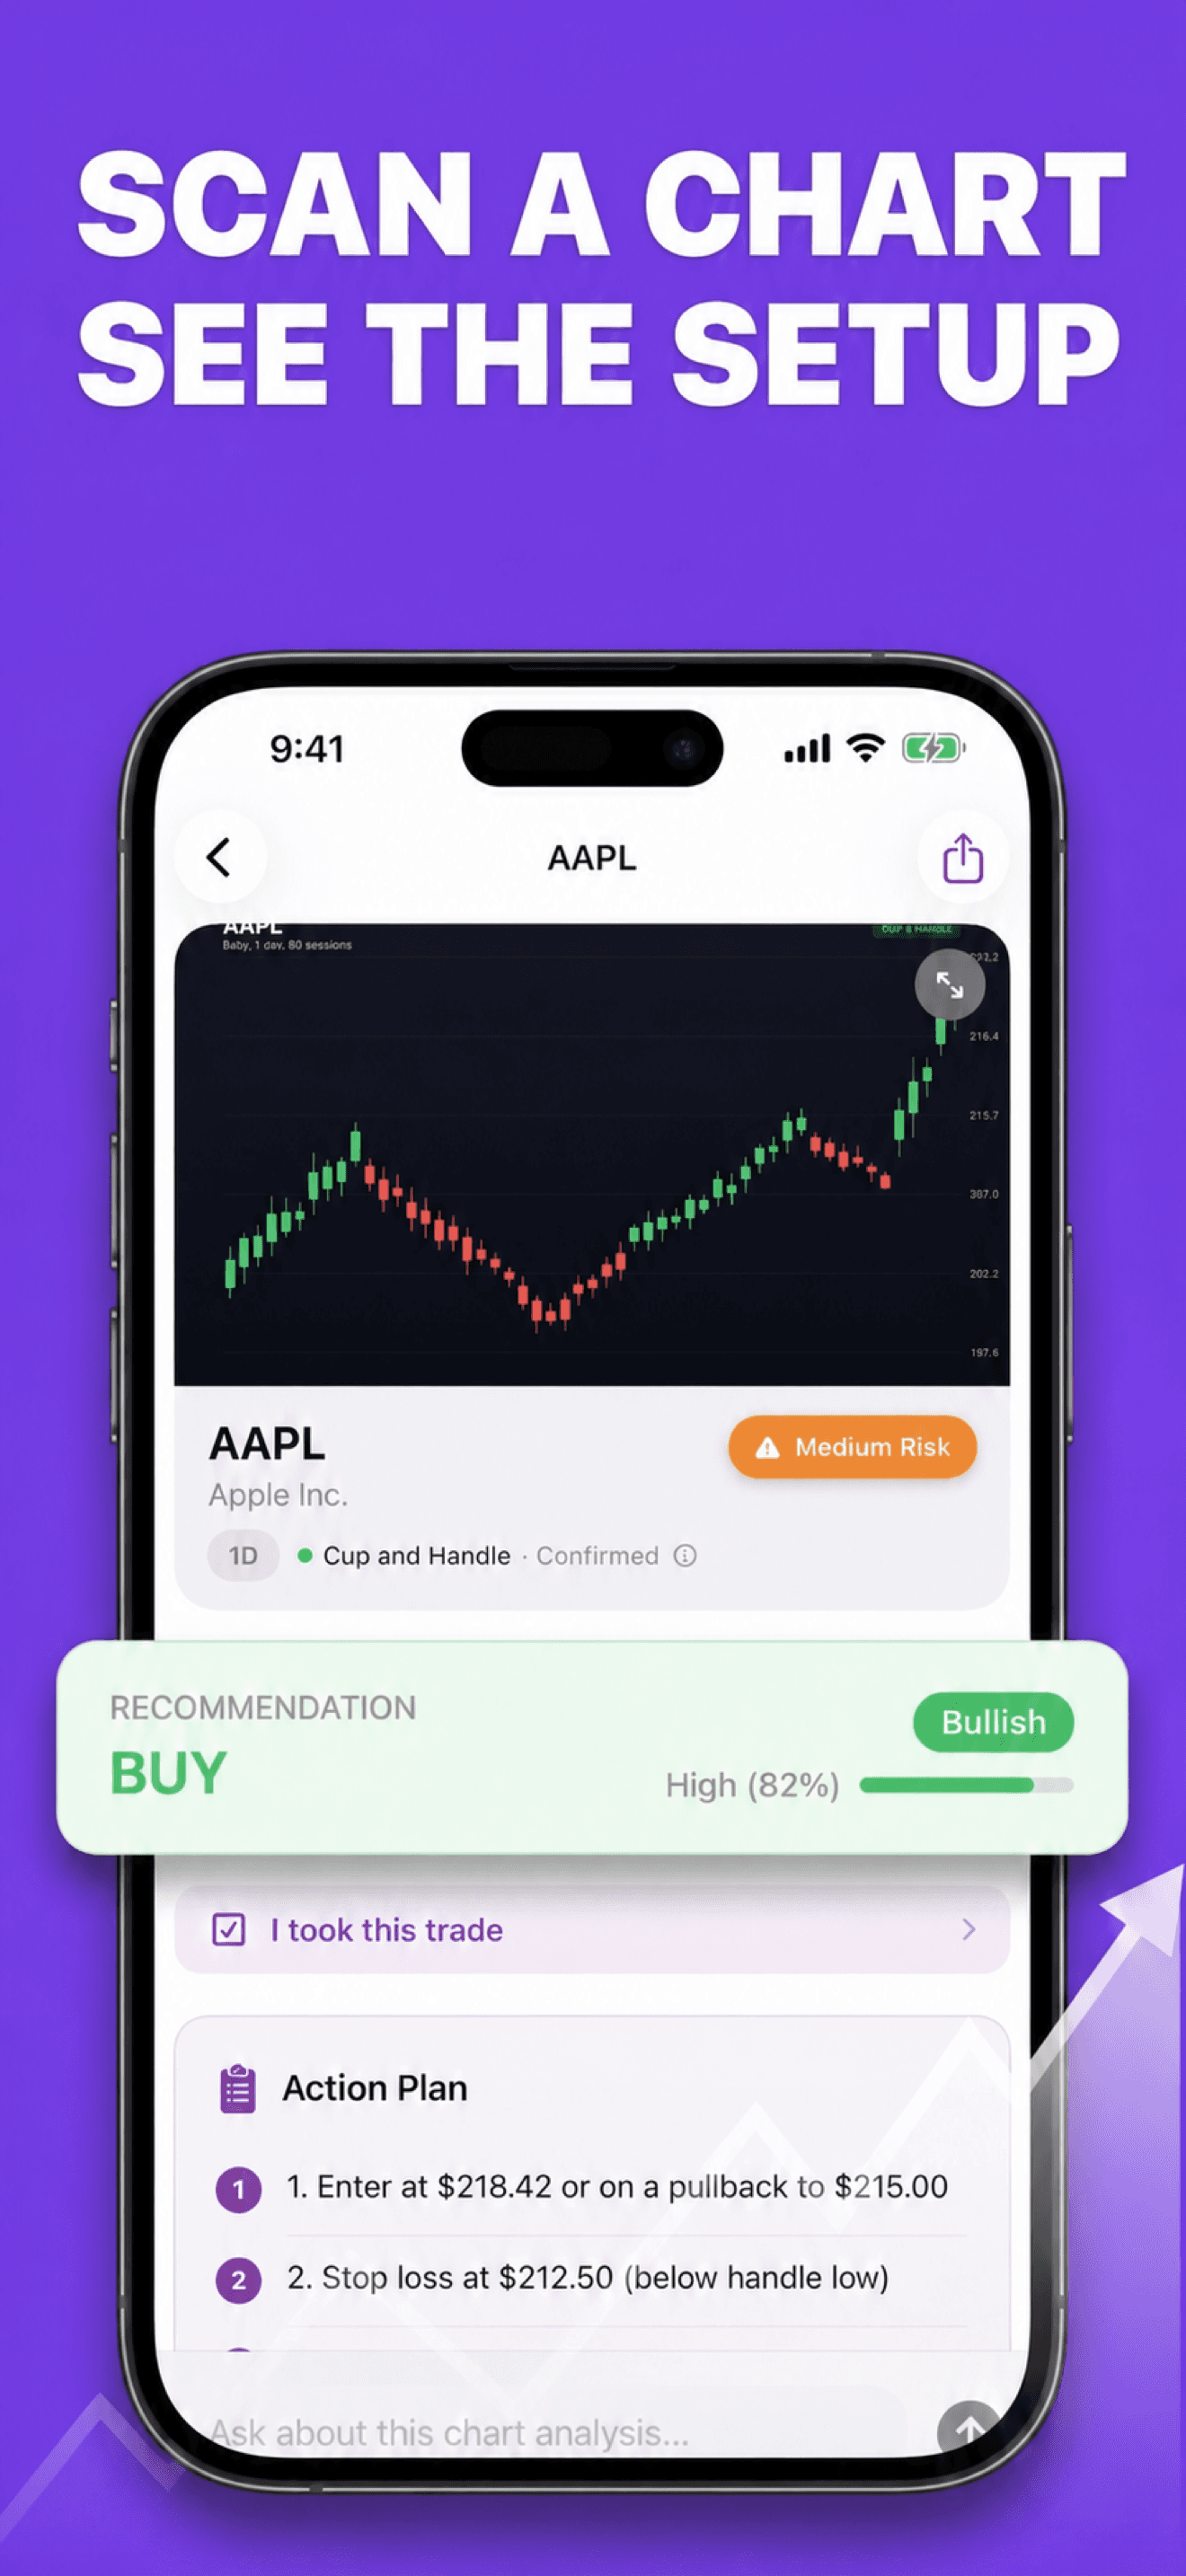
Turn a chart image into an organized research workspace with patterns, key levels, bull/base/bear scenarios, private notes, a paper-trade journal, and a built-in glossary.
Built for the task
Chart-image analysis
The short answer
A direct definition for readers, search engines, and answer systems.
Stockalyze is an iPhone app for educational market-chart research. It uses AI to organize visible patterns, indicator context, support, resistance, invalidation, risk levels, and multiple possible scenarios. It also includes a private symbol-and-notes watchlist, manual paper-trade tracking, follow-up questions, and a chart-pattern glossary.
Stockalyze is for education and research, not personalized financial, investment, tax, or legal advice. It does not execute trades or fetch market quotes. AI output can be incomplete or wrong; verify prices independently, and remember that past patterns and paper-trade results do not predict future performance.
Inside the app
Every feature supports the same workflow, so the app feels like a system rather than a folder of disconnected AI buttons.
Capture or import a readable chart screenshot to organize the visible setup and the context shown in the image.
Review possible candlestick or chart patterns alongside support, resistance, invalidation, entry, stop, and target levels.
Compare bull, base, and bear scenarios rather than treating one AI-generated forecast as certainty.
Save symbols with your own notes as a local research notebook. The app does not fetch or display market quotes.
Mark hypothetical trades, close them manually with the outcome you observed, and review your recorded win rate and R-multiple history.
Explore 20+ patterns and indicators, then ask qualified follow-up questions about a saved analysis.
Product tour
Real screens from the current iPhone experience.


How it works
Use a readable screenshot with visible candles, timeframe, symbol, and any indicators you want the AI to consider.
Compare the detected pattern, levels, indicator context, confidence, and invalidation conditions.
Save private notes, record and close a paper trade manually, study the glossary, and verify all information independently before risking capital.
Who it helps
Direct answers
No. Stockalyze does not place orders, hold funds, connect to brokerage accounts, or manage a portfolio. Its analyses and paper trades are educational research tools.
They are AI-generated interpretations and can be incomplete or wrong. A confidence label or probability is not a verified success rate. Check the original chart, current market data from a source you trust, and independent research.
No. Stockalyze does not fetch or display live or delayed market quotes. A detected or entered symbol is used only as context for the chart analysis and for the private notes you choose to save.
A selected chart image and relevant profile context are sent through AIProxy to Anthropic for analysis. Saved analyses remain in the app and may sync through your private iCloud account when enabled. Read the Privacy Policy for provider details and retention limits.
Available on the App Store
Free download · optional Pro. Built by Ideas All Day Ltd for iphone · ios 17.6+.
Download on the App Store